
Predictive Pricing and Forecasting: Complete Guide to Demand Forecasting, Price Optimization, and Revenue Growth

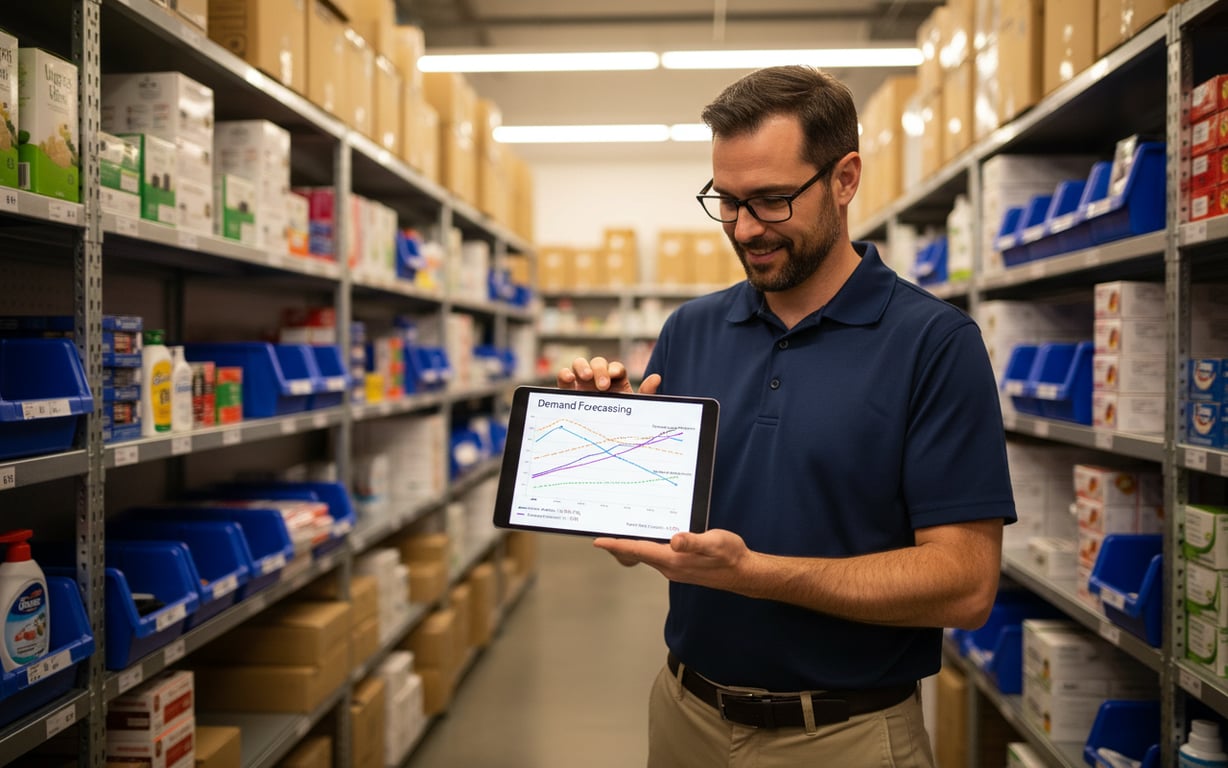
Predictive pricing uses historical data, statistical models, and AI to set optimal prices continuously, while demand forecasting anticipates future market conditions. Together, they form a closed-loop system that drives revenue uplifts of 2% to 7% and margin improvements of 1% to 3%, according to McKinsey research on retail pricing transformations.
What is predictive pricing and forecasting
Predictive pricing is the practice of using historical data, statistical models, and artificial intelligence to determine the optimal price for a product or service at any given moment. Rather than relying on intuition or periodic manual reviews, businesses deploy a price prediction model that continuously analyzes variables such as competitor prices, inventory levels, seasonal patterns, and customer behavior to recommend or automatically set prices that maximize a defined business objective — whether that is margin, revenue, or market share.
Forecasting, in this context, refers to the broader discipline of anticipating future states of demand, supply, and market conditions. When combined with pricing intelligence, demand prediction becomes the engine that feeds the pricing model: if you know that demand for a product will spike 40% in the next two weeks, you can adjust prices proactively rather than reactively.
Together, these two capabilities form a closed-loop system. The forecasting layer generates probabilistic estimates of future demand. The pricing layer translates those estimates into price recommendations. Actual sales data then flows back into both models, improving accuracy over time. This feedback loop is what distinguishes a mature AI pricing strategy from a simple rule-based markdown schedule.
For retail business owners and operations professionals, the practical implication is significant: companies that deploy integrated predictive pricing and forecasting systems consistently report revenue uplifts of 2% to 7% and margin improvements of 1% to 3%, according to McKinsey research on retail pricing transformations. Understanding the foundational mechanics of these systems is the first step toward capturing those gains.
How dynamic pricing works in modern markets
What is dynamic pricing?
Dynamic pricing is the real-time adjustment of prices in response to changing market conditions. Unlike static pricing, where a retailer sets a price and revisits it quarterly, automated pricing systems can update prices multiple times per day — or even per hour — based on a continuous stream of signals.
How a dynamic pricing system processes data and sets prices
Data ingestion: the system pulls in real-time pricing data from competitors, internal inventory counts, current sales velocity, web traffic, and external signals such as weather or local events.
Signal processing:machine learning pricing algorithms weight these inputs according to their historical predictive power. A competitor price drop may carry more weight for a commodity product than for a differentiated brand item.
Price recommendation: the model outputs a suggested price, often with a confidence interval and an expected demand response.
Execution: depending on the organization's governance model, the price is either applied automatically or routed for human approval before going live.
Amazon is the most cited example of dynamic pricing at scale, reportedly changing prices on millions of products every few minutes. But the same principles apply to businesses of all sizes. A regional grocery chain using real-time pricing on perishables can reduce waste by 15% to 20% while maintaining margin. A specialty retailer adjusting prices on slow-moving seasonal inventory can recover working capital weeks earlier than a competitor using fixed markdown schedules.
The critical enabler of effective dynamic pricing is data quality. Garbage-in, garbage-out applies with particular force here: a model trained on incomplete or delayed data will produce price recommendations that erode rather than build margin. Organizations should audit their data pipelines before deploying any machine learning pricing solution, ensuring that point-of-sale data, inventory feeds, and competitor price scrapes are accurate, timely, and consistently formatted. Understanding how data analytics in retail drives business intelligence is therefore a prerequisite for any dynamic pricing initiative.
Demand forecasting fundamentals and methodologies
What is demand forecasting?
Demand forecasting is the process of estimating the quantity of a product or service that customers will purchase over a defined future period. Accurate demand prediction is the foundation of every downstream business decision: inventory purchasing, staffing, promotional planning, and, critically, price setting.
Core demand forecasting methodologies
Qualitative methods: rely on expert judgment, market research, and structured opinion gathering. They are most useful when historical data is sparse — for new product launches, for example.
Quantitative methods: use mathematical models applied to historical data. These range from simple moving averages and exponential smoothing to more sophisticated ARIMA (AutoRegressive Integrated Moving Average) models that capture trend and seasonality simultaneously.
Machine learning methods: the most advanced category, use algorithms such as gradient boosting, neural networks, and ensemble models to identify non-linear relationships across dozens of variables simultaneously.
For most retail businesses, a hybrid approach delivers the best results. A statistical baseline model handles the bulk of SKUs where data is plentiful, while machine learning layers add accuracy for high-velocity or high-value items. Human override capability preserves the ability to incorporate market intelligence that no algorithm can observe — a competitor's announced store closure, for instance, or a supply disruption flagged by a buyer.
Forecast accuracy is typically measured using Mean Absolute Percentage Error (MAPE) or Weighted Mean Absolute Percentage Error (WMAPE). Industry benchmarks vary by category: grocery retailers typically target MAPE below 15% at the weekly SKU-store level, while fashion retailers, dealing with shorter product lifecycles, may accept MAPE of 25% to 35%. Exploring the full range of retail forecasting methods helps organizations select the right technique for their specific category and data maturity. Price forecasting, which estimates how demand will respond to price changes, is a specialized sub-discipline that feeds directly into the optimization layer.
Price optimization strategies for revenue growth
What is price optimization?
Price optimization is the discipline of finding the price point that best achieves a defined business objective, given known or estimated demand elasticity. It sits at the intersection of economics, data science, and business strategy, and it is where the outputs of demand forecasting are translated into actionable pricing decisions.
The most fundamental concept in price optimization is price elasticity of demand: the percentage change in quantity demanded for a one-percent change in price. A product with an elasticity of -2.0 will see demand fall by 2% for every 1% price increase. Understanding elasticity at the SKU level — and how it varies by customer segment, channel, and time of year — is the prerequisite for any serious optimization effort.
Price optimization strategies commonly deployed for revenue growth
Competitive pricing optimization: uses real-time competitor data to maintain a defined price position — for example, always within 3% of the lowest market price for key value items.
Margin-based optimization: sets a floor on gross margin and then maximizes revenue within that constraint.
Promotional price optimization: models the incremental volume lift from a promotion against its margin cost to identify which promotions are genuinely profitable versus those that merely shift timing of purchases.
Bundle pricing optimization: identifies product combinations where a discounted bundle price generates higher total margin than individual item sales.
For retailers managing thousands of SKUs, manual optimization is impossible. This is where AI-driven pricing and promotion optimization solutions become essential infrastructure. These platforms automate the elasticity estimation, scenario modeling, and price recommendation workflow, enabling pricing teams to focus on strategy and exception management rather than spreadsheet calculations. Dynamic pricing capabilities within these platforms allow revenue forecasting to be updated in near real-time as market conditions shift, closing the loop between prediction and execution.
Practical implementation sequence for a mid-size retailer
Begin with a price audit to identify items where current prices are misaligned with elasticity.
Deploy competitive monitoring on the top 20% of SKUs by revenue.
Implement automated repricing on commodity categories first.
Progressively extend optimization to differentiated and private-label items as model confidence grows.
Revenue forecasting techniques and financial planning
Revenue forecasting translates demand predictions and price optimization outputs into financial projections that inform budgeting, capital allocation, and investor communications. It is the bridge between operational analytics and the finance function, and its accuracy has direct consequences for business planning quality.
Bottom-up vs. top-down revenue forecasting
Bottom-up forecast
Method: Aggregates SKU-level demand forecasts multiplied by expected selling prices across all channels and geographies
Strengths: Granular and operationally grounded
Limitations: Can be time-consuming to maintain
Top-down forecast
Method:: Starts from macroeconomic indicators, market size estimates, and historical growth rates to project total category or company revenue
Strengths: Fast and strategically aligned
Limitations: Less operationally precise
The two approaches should be reconciled: significant divergence between them is a signal that either the operational assumptions or the macro assumptions need revisiting.
Price forecasting plays a critical role in revenue projection accuracy. If a retailer expects to implement a 5% average price increase over the next quarter, the revenue forecast must model not just the price effect but also the demand response — the volume erosion that will partially offset the price gain. Ignoring elasticity in revenue forecasting is one of the most common and costly errors in retail financial planning.
Rolling forecasts, updated monthly or even weekly, outperform annual static budgets in volatile markets. Advanced demand planning best practices recommend integrating revenue forecasting directly into the Sales and Operations Planning (S&OP) process, ensuring that finance, commercial, and supply chain teams are working from a single version of the truth. Scenario planning — modeling best-case, base-case, and downside revenue outcomes — adds resilience to the forecasting process by preparing leadership for a range of market conditions.
Implementing automated pricing systems
Deploying an automated pricing system is a significant organizational undertaking that requires careful sequencing across technology, process, and change management dimensions. Organizations that treat it purely as a software implementation project consistently underperform relative to those that invest equally in the human and process layers.
Six stages for implementing an automated pricing system
Define objectives: be specific about whether the primary goal is margin improvement, revenue growth, competitive positioning, or inventory turn. Different objectives require different model configurations.
Audit data infrastructure: automated pricing systems require clean, timely feeds of sales transactions, inventory positions, and competitor prices. Gaps in any of these streams will degrade model performance.
Select a platform: evaluate vendors on the basis of their demand modeling capabilities, integration flexibility, explainability of recommendations, and track record in your specific retail category.
Pilot in a controlled environment: select a category or store cluster that is representative but not so critical that errors would be catastrophic. Run the automated system in shadow mode — generating recommendations without acting on them — for four to six weeks to validate accuracy before going live.
Establish governance: define who has authority to override automated recommendations, under what circumstances, and how overrides are logged and reviewed. Without governance, automated pricing can drift from strategic intent.
Scale and optimize: once the pilot demonstrates positive results, expand the system progressively while continuously retraining models on new data.
Real-time pricing capabilities require particular attention to latency and reliability. If a price change takes 30 minutes to propagate from the pricing engine to the point-of-sale system, the competitive advantage of real-time responsiveness is largely lost. Integration architecture — APIs, data pipelines, and system synchronization — must be designed for speed and resilience from the outset.
Change management is often the most underestimated challenge. Pricing managers accustomed to manual control may resist algorithmic recommendations, particularly when the model suggests counterintuitive moves. Building trust through transparency — showing the reasoning behind each recommendation — and celebrating early wins publicly are both essential tactics for driving adoption. A comprehensive retail data analysis framework can help teams understand and trust the data inputs that drive machine learning pricing decisions.

Industry applications and use cases
Predictive pricing and demand forecasting are not confined to a single industry. Their application spans virtually every sector where supply and demand interact, though the specific implementation varies considerably by business model and competitive context.
E-commerce and retail: online retailers use dynamic pricing to respond to competitor moves within minutes, while brick-and-mortar chains deploy electronic shelf labels that allow price updates across thousands of store locations simultaneously. Grocery retailers apply demand prediction to perishable categories to minimize waste while maximizing availability. Fashion retailers use price optimization to manage end-of-season clearance, modeling the trade-off between early markdowns that preserve sell-through and delayed markdowns that protect margin.
Travel and hospitality: airlines and hotels have practiced revenue management — an early form of dynamic pricing — for decades. Modern systems extend these capabilities with machine learning, enabling hotels to optimize room rates across hundreds of rate categories and booking windows simultaneously.
Energy and mobility markets: utilities and trading firms use real-time pricing models to respond to fluctuations in generation capacity and grid demand. Ride-sharing platforms apply surge pricing algorithms that balance driver supply with passenger demand in real time, a textbook application of automated pricing at scale.
B2B manufacturing and distribution:price optimization addresses the complexity of negotiated contracts, volume discounts, and customer-specific pricing. Here, the AI pricing strategy focuses on identifying which customers are price-sensitive versus value-sensitive, enabling sales teams to defend margin with the former while investing in service with the latter.
Across all these sectors, the common thread is the use of data and algorithms to replace guesswork with precision.
Measuring success and optimizing performance
Deploying a predictive pricing or forecasting system is not a one-time event — it is an ongoing management discipline. Measuring performance rigorously and using those measurements to drive continuous improvement is what separates organizations that sustain pricing gains from those that see initial results erode over time.
Key KPIs for pricing and forecasting systems
Revenue and margin metrics: gross margin percentage, revenue per unit, and price realization rate — the ratio of actual achieved price to list price.
Forecast accuracy metrics: MAPE, bias (systematic over- or under-forecasting), and forecast value added (FVA), which measures how much the statistical model improves on a naive baseline.
Operational metrics: the percentage of SKUs covered by automated pricing, override rate (how often human managers override algorithmic recommendations), and system uptime.
Benchmarking against industry peers provides essential context. A 10% improvement in forecast accuracy sounds impressive in isolation, but if competitors are achieving 20% improvements with newer platforms, the relative competitive position has actually deteriorated. Regular competitive benchmarking, combined with internal trend analysis, keeps the performance improvement agenda honest.
Price optimization performance should be reviewed in a structured cadence: weekly for operational metrics, monthly for revenue and margin outcomes, and quarterly for strategic alignment. Each review cycle should generate a prioritized list of model improvements, data quality fixes, and process changes. This continuous improvement loop is what transforms a pricing system from a static tool into a compounding competitive advantage.
Current trends in predictive pricing technology
The technology landscape for predictive pricing and forecasting is evolving rapidly, driven by advances in artificial intelligence, cloud computing, and data infrastructure. Several trends are reshaping what is possible for retail businesses of all sizes.
Large language models (LLMs) and generative AI: beginning to influence pricing strategy by enabling natural-language interfaces for pricing analysts. Instead of writing SQL queries or configuring dashboards, a pricing manager can ask a system in plain English: "Which SKUs in the beverage category are underpriced relative to their elasticity?" and receive an actionable answer within seconds. This democratizes access to pricing intelligence across the organization.
Causal AI: models cause-and-effect relationships rather than mere correlations, improving the accuracy of price prediction AI in complex, multi-variable environments. Traditional machine learning pricing models can identify that a price change correlates with a demand shift, but causal models can distinguish whether the price change caused the demand shift or whether both were driven by a third factor, such as a competitor promotion.
Edge computing: enabling real-time pricing at the physical store level without dependence on cloud latency, while federated learning allows retailers to train pricing models on distributed data without centralizing sensitive customer information.
Expanded external data integration: social media sentiment, weather forecasts, macroeconomic indicators, and even satellite imagery of competitor parking lots are expanding the signal set available to AI pricing strategy systems, pushing forecast accuracy and pricing precision to levels that were unimaginable just five years ago.

Frequently Asked Questions
What is the difference between predictive pricing and dynamic pricing? Predictive pricing uses historical data and machine learning models to forecast optimal future prices before market conditions change. Dynamic pricing is the real-time execution mechanism that adjusts prices as conditions shift. In practice, predictive pricing feeds the forecasts that dynamic pricing systems act upon — they are complementary layers of the same overall capability.
How accurate are demand forecasting models in retail? Accuracy varies significantly by category and data maturity. Grocery retailers typically achieve MAPE below 15% at the weekly SKU-store level with well-tuned models. Fashion and seasonal categories, with shorter product lifecycles and higher demand volatility, may see MAPE of 25% to 35%. Machine learning models generally outperform traditional statistical methods by 10% to 20% in accuracy when sufficient training data is available.
How long does it take to implement an automated pricing system? A typical implementation timeline ranges from three to nine months, depending on organizational complexity, data infrastructure readiness, and the number of SKUs in scope. A focused pilot covering a single category can go live in six to eight weeks. Full enterprise deployment across all categories and channels typically takes six to twelve months, including data integration, model training, governance setup, and change management.
What data is required to build a price prediction model? At minimum, a price prediction model requires historical sales transactions (ideally two or more years), historical pricing data at the SKU level, and inventory position data. More sophisticated models also incorporate competitor prices, promotional calendars, weather data, macroeconomic indicators, and customer segmentation data. Data quality and consistency are more important than data volume — a clean two-year dataset outperforms a noisy five-year dataset.
Can small and mid-size retailers benefit from predictive pricing? Yes. Cloud-based pricing platforms have dramatically reduced the cost and technical complexity of deploying predictive pricing. Many solutions are now available as SaaS subscriptions with per-SKU or per-user pricing models that are accessible to smaller retailers. The key is to start with a focused use case — such as competitive pricing on top-selling items — and expand as confidence and capability grow.
How does price elasticity affect pricing strategy? Price elasticity measures how sensitive customer demand is to price changes. Products with high elasticity see significant demand changes with small price moves, making aggressive pricing risky but also making promotional discounts highly effective at driving volume. Products with low elasticity can sustain price increases with minimal volume loss, making them prime candidates for margin improvement. Understanding elasticity at the SKU and customer-segment level is the foundation of any effective price optimization strategy.
What is forecast value added (FVA) and why does it matter? Forecast Value Added measures how much each step in the forecasting process improves accuracy relative to a simple baseline, such as a naive forecast that assumes next period's demand equals last period's demand. FVA analysis identifies which forecasting activities are genuinely adding accuracy and which are introducing bias or noise. It is a powerful diagnostic tool for improving forecasting processes and justifying investment in more sophisticated models.
How do retailers prevent customer backlash from dynamic pricing? Transparency and consistency are the primary tools for managing customer perception of dynamic pricing. Retailers should communicate clearly when and why prices change — for example, framing time-limited promotions as rewards for early purchase rather than penalties for late purchase. Avoiding price increases during supply disruptions or emergencies is critical for brand trust. Many retailers also implement price floors and ceilings that prevent algorithmic recommendations from producing prices that would damage customer relationships.
What is the role of AI in modern pricing strategy? Artificial intelligence enables pricing strategy to operate at a scale and speed that is impossible with manual processes. AI models can simultaneously analyze thousands of variables across millions of SKUs, identify non-linear demand patterns that statistical models miss, and generate price recommendations in milliseconds. Beyond automation, AI adds value through continuous learning and through scenario simulation, allowing pricing teams to model the revenue and margin impact of strategic decisions before implementing them.
How should organizations measure the ROI of a pricing optimization system? ROI measurement should track three primary value streams: revenue uplift, margin improvement, and operational efficiency gains. A rigorous measurement approach uses a holdout group — a set of products or stores not yet using the system — as a control, comparing performance against the optimized group over the same period. Most organizations achieve full payback on pricing system investments within 12 to 18 months.


Comments